Glossary
OpenScenario
This format was proposed by ASAM (Association for Standardization of Automation and Measuring Systems) as a format for describing scenarios. https://www.asam.net/standards/detail/openscenario/
OpenDrive
This format was proposed by ASAM (Association for Standardization of Automation and Measuring Systems) as a format for describing roads. https://www.asam.net/standards/detail/opendrive/
Evaluation Scenario
Autonomous driving scenarios have multiple names depending on their level of abstraction. Scenario classifications such as "cut-in scenarios" can be considered highly abstract scenarios and are called functional scenarios.
In this manual, "evaluation scenario" means a "concrete scenario" that includes all the information required to run a simulation (= low level of abstraction), that is, it includes a scenario classification and specific numerical values of the parameters that describe the scenario. An example is shown below.
Item |
Example |
Unit |
|---|---|---|
Scenario classification |
4 |
[-] |
\(V_{e0}\) |
50.0 |
[km/h] |
\(V_{o0}\) |
30.0 |
[km/h] |
\(V_{e0}-V_{o0}\) |
20.0 |
[km/h] |
\(d_{x0}\) |
20.0 |
[m] |
\(V_{y}\) |
1.1 |
[m/s] |
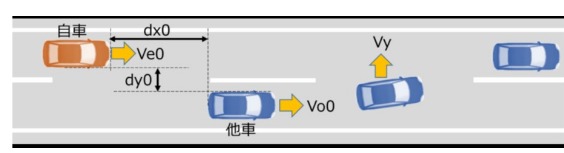
This diagram is taken from "Autonomous Driving Safety Assessment Framework Ver. 3.0" published by the Japan Automobile Manufacturers Association. 
Evaluation Specifications
Define evaluation scenarios. If an evaluation specification defines multiple evaluation scenarios, they will have a common scenario classification. An example is shown below.
Item |
Evaluation scenario 1 |
Evaluation scenario 2 |
|---|---|---|
Scenario classification |
4[-] |
4[-] |
\(V_{e0}\) |
50.0[km/h] |
50.0[km/h] |
\(V_{o0}\) |
30.0[km/h] |
30.0[km/h] |
\(V_{e0}-V_{o0}\) |
20.0[km/h] |
20.0[km/h] |
\(d_{x0}\) |
20.0[m] |
20.0[m] |
\(d_{y0}\) |
1.0[m] |
1.0[m] |
\(V_{y}\) |
1.1[m/s] |
1.2[m/s] |
ODD
Operational Design Domain.
Distribution Type
A type of model that approximates the distribution of real data. Currently, three types (Normal, Exponential, and Beta) are available.
AIC:「Akaike information criterion」
This is an index that evaluates the quality of a statistical model that approximates the distribution of real data.
Class Frequency
This represents the number of bars that represent the distribution of the actual data.
Pseudo Curvature
It is calculated from the vehicle's trajectory information rather than from the road shape, and since the calculation results vary depending on the conditions and environment at the time of data collection, it is defined as a pseudo-determined curvature.