Reference
Real traffic data
The real traffic data obtained using measurement vehicles and fixed-point observations is as shown below. From this real traffic data, examples of scenarios corresponding to traffic disturbances were extracted. Data analysis was performed for each example, and parameters describing the scenario were calculated ※ .
※ Some of the results of the analysis were used to create this public version.
Real data from measurement vehicles
Real traffic data was collected on the Metropolitan Expressway and the Tomei and Shin-Tomei Expressways from FY2018 to FY2021. The driving times and mileages for each are shown below.
Location |
Time(h:mm:ss) |
Mileage(km) |
|---|---|---|
Metropolitan Expressway |
1384:44:37 |
69,215 |
Tomei and Shin-Tomei Expressways |
1845:05:58 |
110,507 |
Total |
3229:50:35 |
179,722 |
There are two driving routes on the Metropolitan Expressway: Route A and Route B, as shown below.
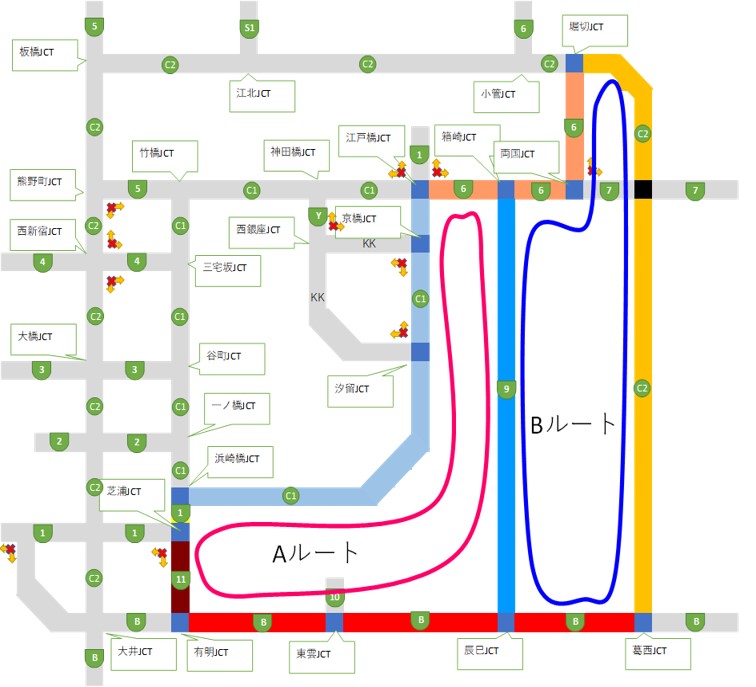
Route A (25 minutes), Route B (40 minutes)
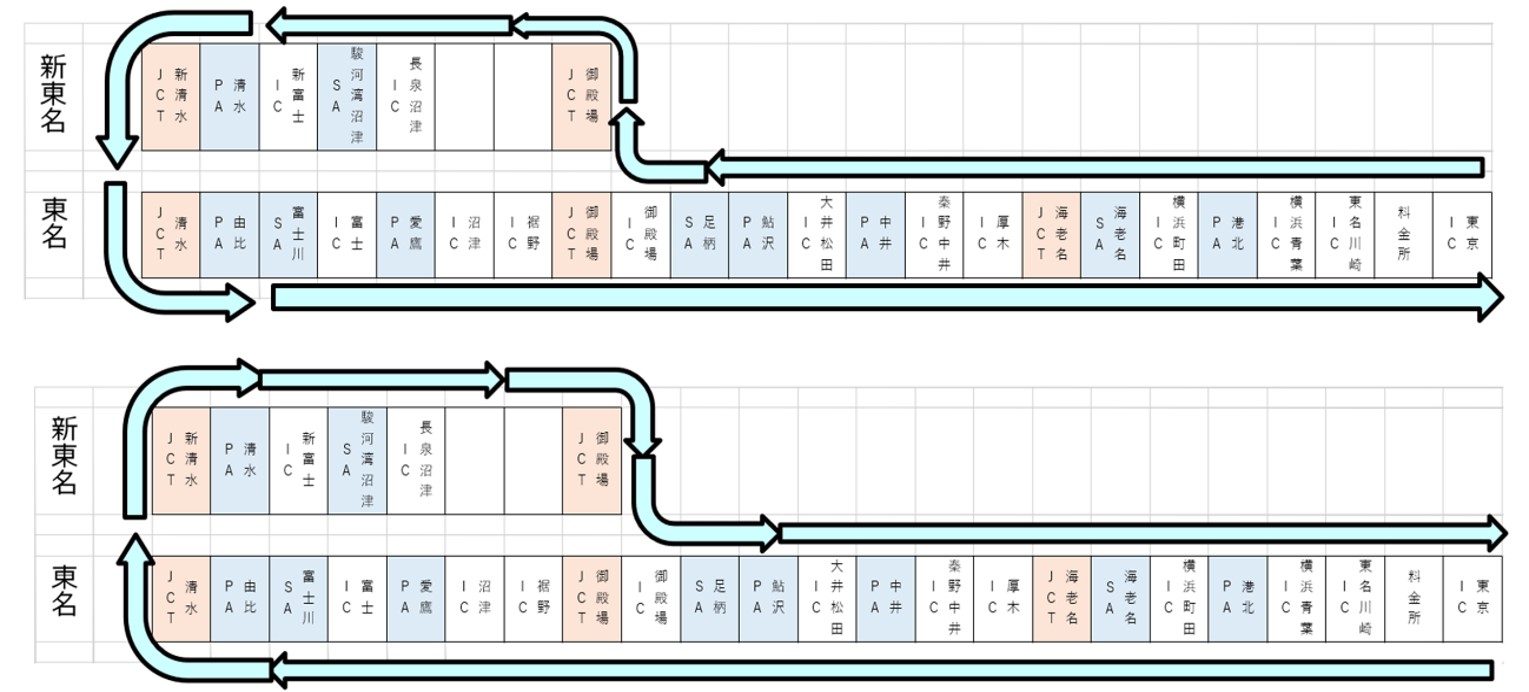
The driving route on the Tomei and Shin-Tomei Expressways is shown below.
Real traffic data from fixed point observations
From 2018 to FY2022, we conducted fixed-point observations and collected actual traffic data at the locations listed below.
Location |
Observation year |
Analysis time[min] |
|---|---|---|
Metropolitan Expressway Route 1 Downbound_Hinode_Main Line |
2018 |
320 |
Metropolitan Expressway Route 4 Upbound_Sangu-bashi_Main Line |
2018 |
40 |
Daisan-Keihin Road, Outbound, Kouhoku IC, Main Line |
2018 |
165 |
Metropolitan Expressway Route 5 Downbound_Higashi-Ikebukuro_Merge |
2019 |
900 |
Metropolitan Expressway Route 5 Upbound_Higashi-Ikebukuro_Fork |
2019 |
900 |
Metropolitan Expressway Route 3 Downbound_Shibuya_Merge |
2022 |
900 |
Tomei Expressway, outbound, near Hachioji Kaido, main line |
2018,2020 |
220 |
Tomei Expressway, inbound, Yokohama Machida IC, branch road |
2018 |
70 |
Tomei Expressway, inbound, Yokohama Machida IC, merge road |
2019 |
380 |
Tomei Expressway, outbound, Yokohama Machida IC, ramp |
2019 |
80 |
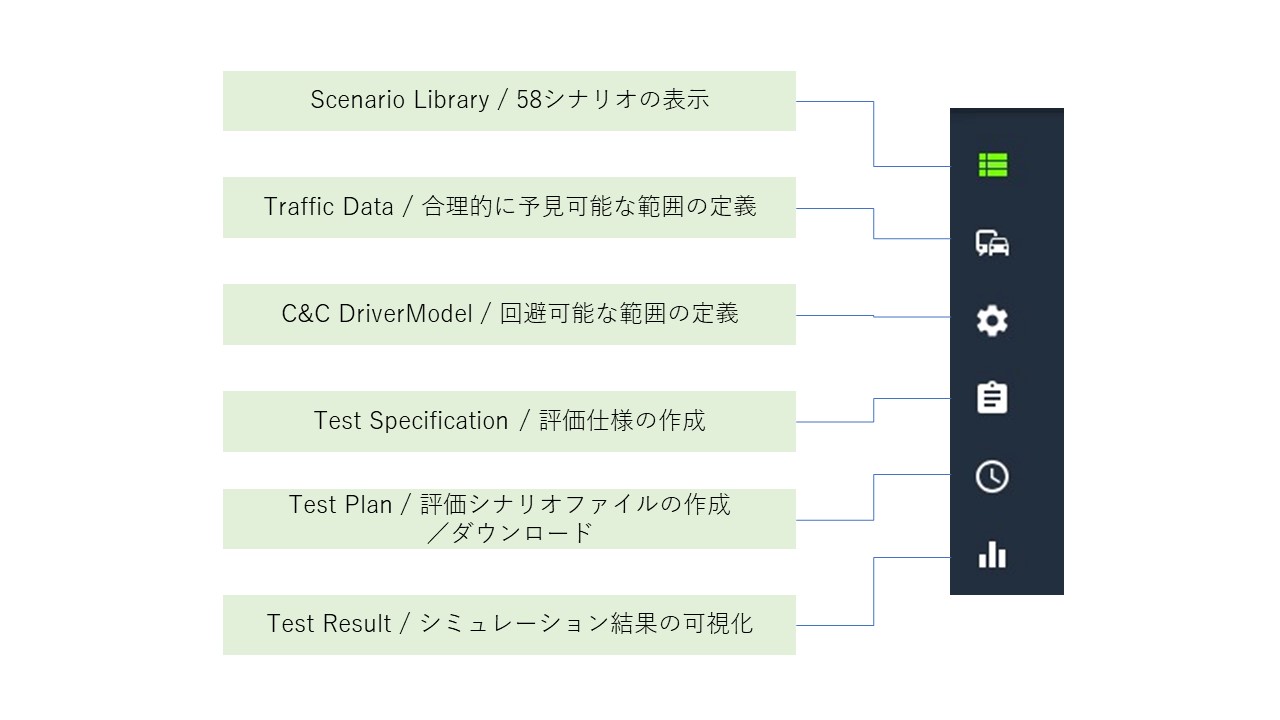
Names and meanings of icons in the scenario database
The meanings of the icons in the scenario database are as follows:
Parameters describing scenario "No.4"
Parameter |
Meaning |
Abbreviation |
|---|---|---|
\(V_{e0}\) |
Ego vehicle(Autonomous Vehicle) initial longitudinal velocity |
Vehicle under test initial longitudinal velocity |
\(V_{o0}\) |
Initial longitudinal velocity of other vehicle that cut-in in ahead of ego vehicle |
Challenging vehicle initial longitudinal velocity |
\(V_{e0}-V_{o0}\) |
Initial longitudinal velocity of ego vehicle based on other vehicle |
Initial longitudinal relative velocity |
\(d_{x0}\) |
Initial longitudinal distance between ego vehicle and other vehicle |
Initial longitudinal distance |
\(d_{y0}\) |
Initial lateral distance between ego vehicle and other vehicle |
Initial lateral distance |
\(V_{y}\) |
Maximum lateral velocity of other vehicle |
Maximum lateral velocity |
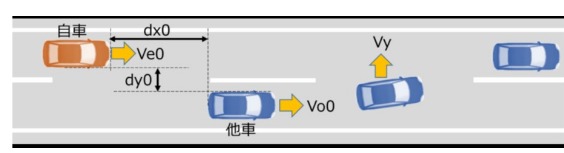
This diagram is taken from "Autonomous Driving Safety Assessment Framework Ver. 3.0" published by the Japan Automobile Manufacturers Association. In scenario "No. 4," the vehicle and other vehicles start from driving in the center of the lane.