① Define Reasonably Foreseeable Range
In this chapter, we explain the procedure for defining the "reasonably foreseeable" range using a scenario database built based on actual traffic flow data collected by measurement vehicles and fixed point observations. ※1.
The outline is as follows:
A scenario for safety evaluation is selected from 58 scenarios ※2 , and the range of parameters describing the scenario is defined.Then, cases that meet these conditions are extracted from the scenario database. The distribution of the parameters of the extracted case groups is approximated by a probability distribution, and the "reasonably foreseeable" range is defined from the percentile values.
※1 A method for defining the "reasonably foreseeable" range is proposed in Defining Reasonably Foreseeable Parameter Range Using Real-World Traffic Data for Scenario-Based Safety Assessment of Automated Vehicles.This manual explains the procedure according to that suggestion.
※2 In the FY24 public version, you can choose from「No.2」「No.4」「No.5」「No.9」「No.10」「No.12」「No.13」「No.18」「No.20」「No.21」「No.23」「No.24」「No.26」「No.27」「No.30」「No.32」「No.33」「No.35」「No.36」「No.38」「No.39」「No.42」「No.52」.
Scenario selection
Left-click the second icon※ from the top on the left side of the screen.

※ The names and meanings of the icons in the scenario database are listed in the reference.
A tab called "Surrounding Traffic Database" has been added※.This tab will be used to understand the "reasonably foreseeable" range.
※ The "reasonably foreseeable" range will be used in Example 1: Make evaluation specifications based on the reasonably foreseeable range, which will be explained later. The "Surrounding Traffic Database" tab has been added with this work in mind.
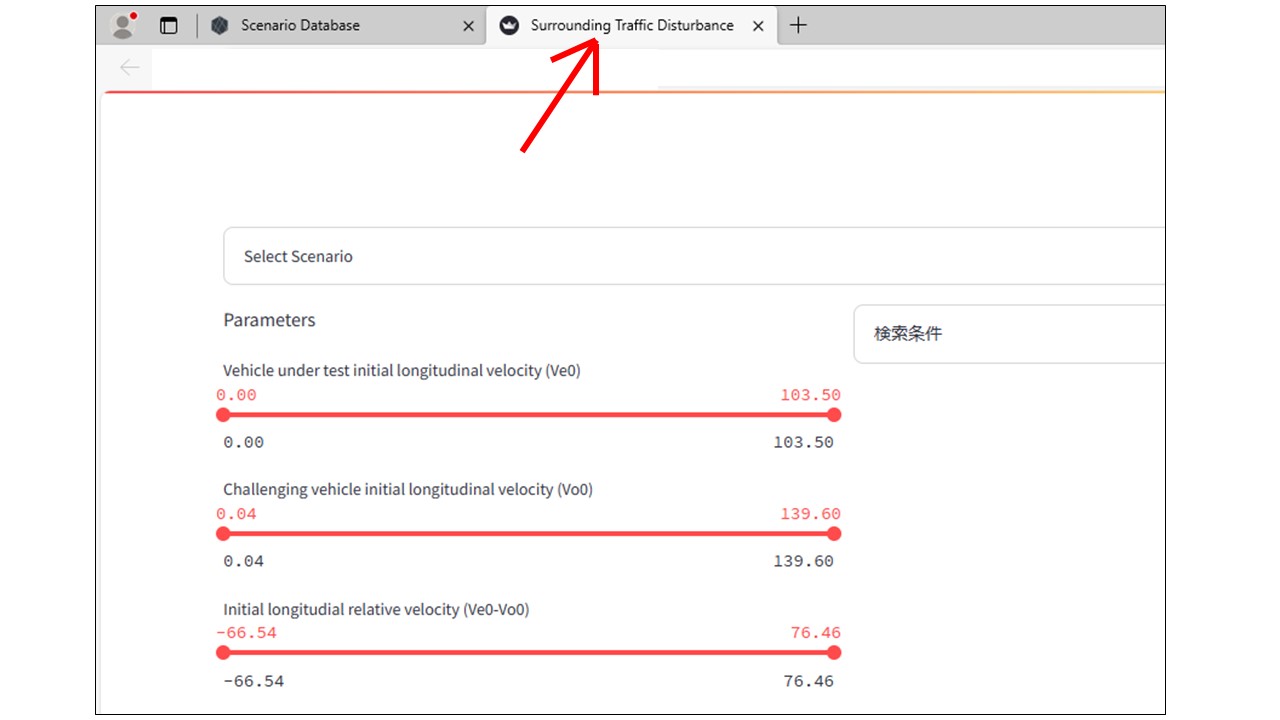
Left-click on "Select Scenario" displayed on the screen. The following screen will be displayed.
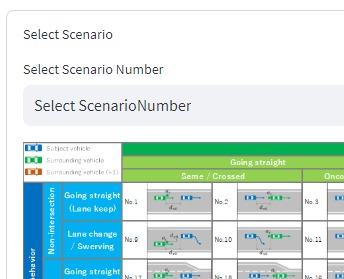
Left-click on "Select Scenario Number" in the pull-down menu, and multiple evaluation scenarios will be displayed, as shown below.
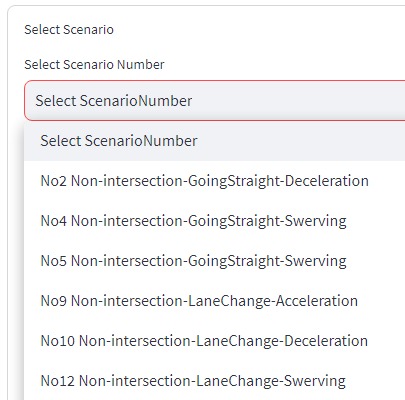
The scenario explained in this tutorial is "No4 Non-intersection-Going Straight-Swerving" (hereafter abbreviated as "No.4"). Left-clicking on it will display the following screen※.
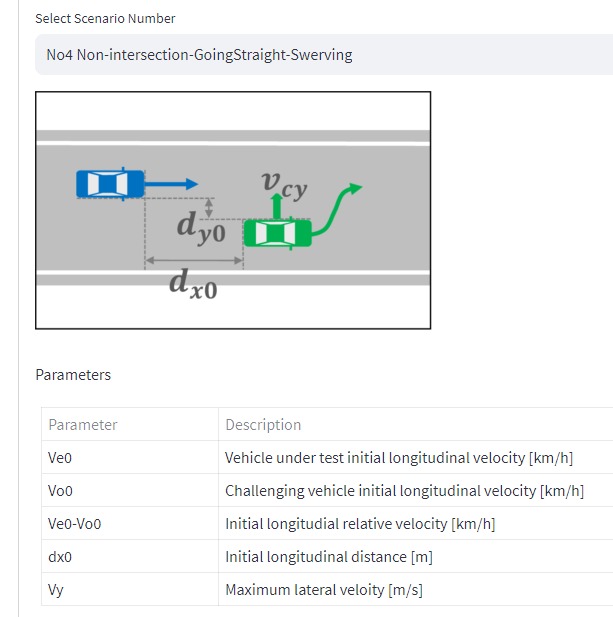
※ The parameter names in the diagram and the description do not match.This will be fixed in the future. This manual uses the parameter names from the descriptions.For example, to measure the lateral speed of other vehicle, use \(V_{y}\) instead of \(V_{cy}\).
The six parameters \(V_{e0}\) ~ \(V_y\) in the description and the initial lateral distance \(d_{y0}\) are the parameters that describe scenario "No.4". Of these, \(d_{y0}\) is calculated using the lane width and the body width of ego vehicle and other vehicles.\(V_{e0}\) ~ \(V_y\) will be set using the scenario database.
Parameter |
Meaning |
Abbreviation |
|---|---|---|
\(V_{e0}\) |
Ego vehicle(Autonomous Vehicle) initial longitudinal velocity |
Vehicle under test initial longitudinal velocity |
\(V_{o0}\) |
Initial longitudinal velocity of other vehicle that cut-in in ahead of ego vehicle |
Challenging vehicle initial longitudinal velocity |
\(V_{e0}-V_{o0}\) |
Initial longitudinal velocity of ego vehicle based on other vehicle |
Initial longitudinal relative velocity |
\(d_{x0}\) |
Direction of travel of ego vehicle and other vehicle Initial distance between vehicles |
Initial longitudinal distance |
\(d_{y0}\) |
Initial lateral distance between ego vehicle and other vehicle |
Initial lateral distance |
\(V_{y}\) |
Maximum lateral velocity of other vehicle |
Maximum lateral velocity |
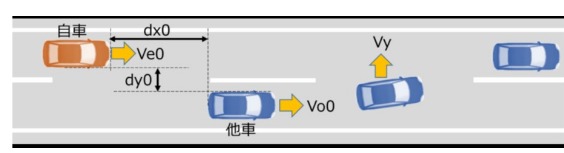
This diagram is taken from the "Autonomous Driving Safety Assessment Framework Ver. 3.0" published by the Japan Automobile Manufacturers Association. In "No. 4," ego vehicle and other vehicle start from the center of the lane.
Define parameter ranges taking ODD into account
When scenario "No. 4" is selected, cases that match the conditions are extracted from the scenario database.
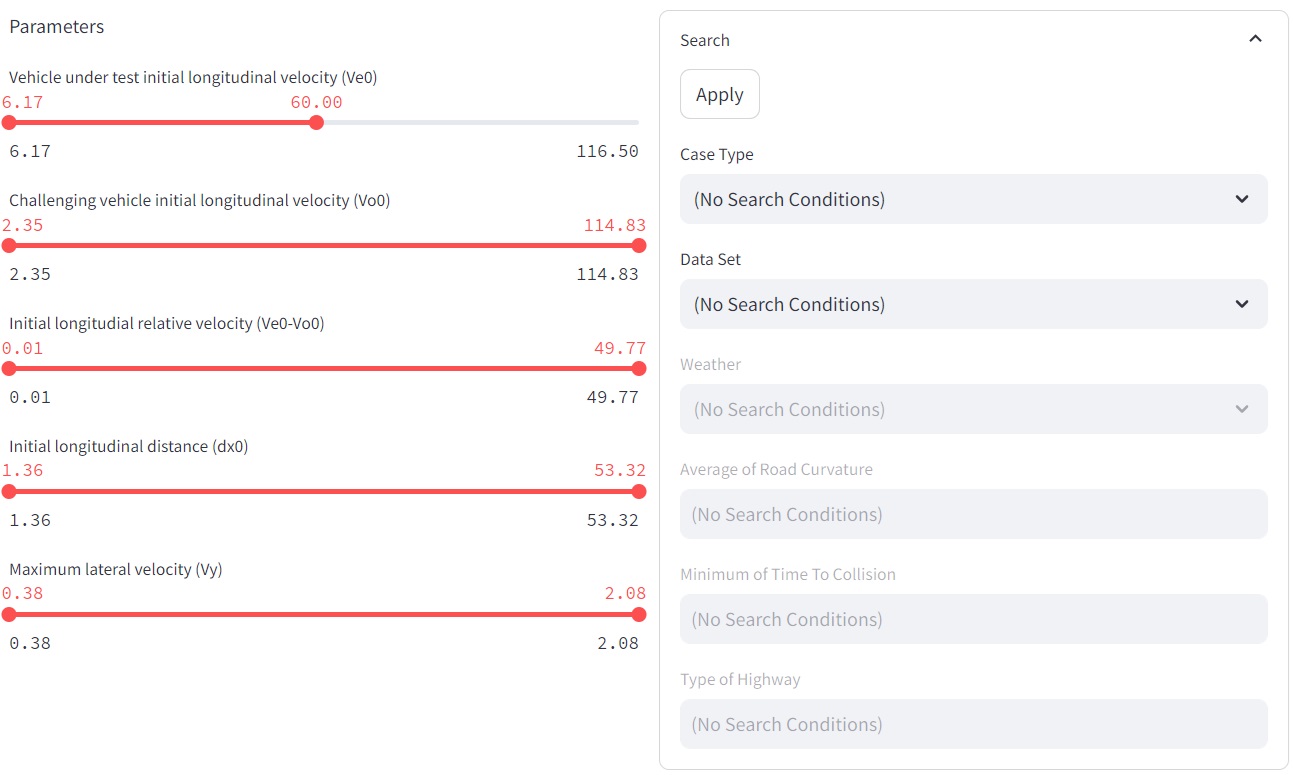
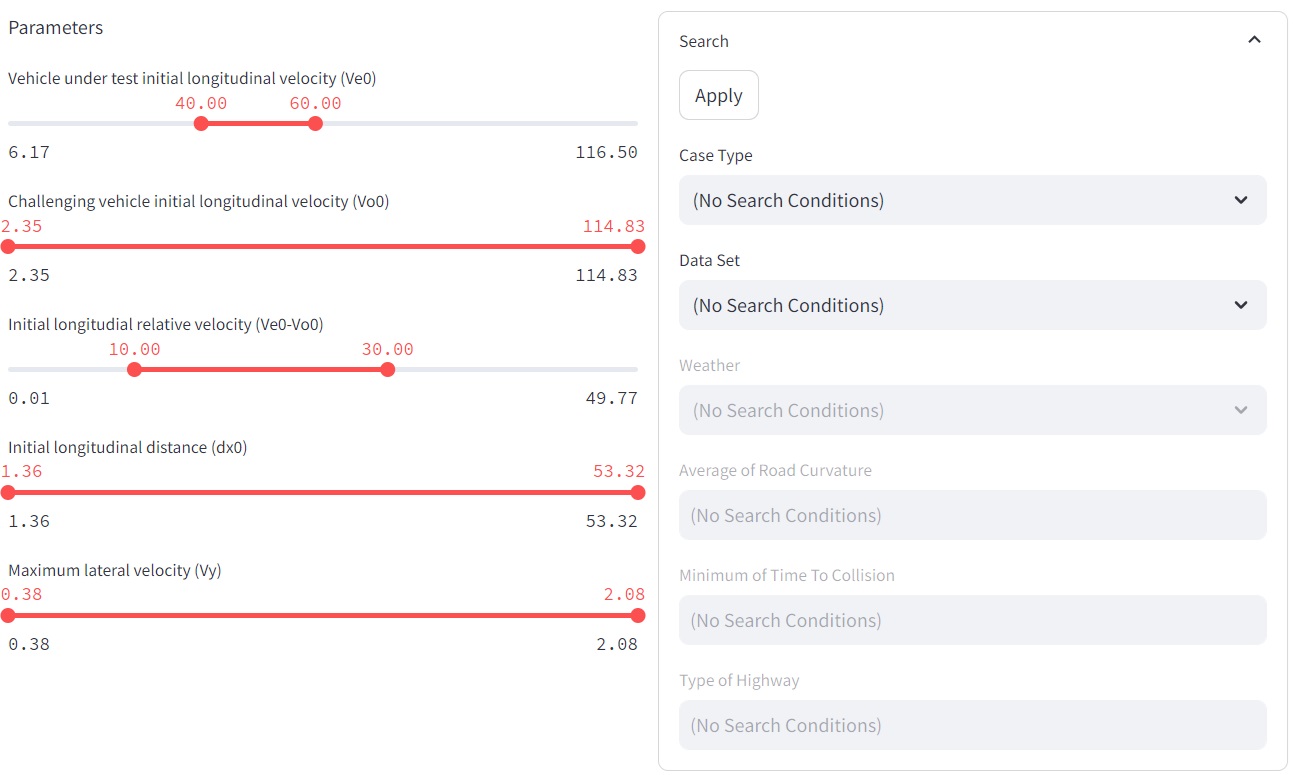
As an index showing the distribution of this group of cases, the maximum and minimum values of the parameters describing the scenario (five in the case of scenario "No. 4") are shown as follows. For example, the maximum and minimum values of \(V_{e0}\) are 116.50 [km/h] and 6.17 [km/h]. The maximum and minimum values of \(V_{e0}-V_{o0}\) are 49.77 [km/h] and 0.01 [km/h].
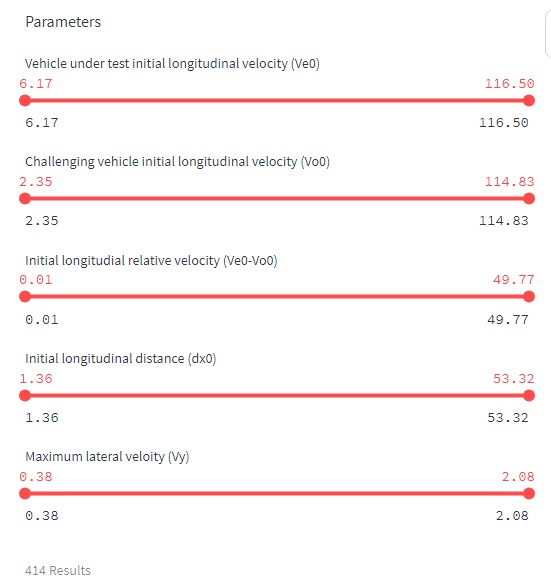
The above screen shows the maximum and minimum values for each parameter and also provides an interface for setting the conditions for the data to be extracted, as will be explained later.
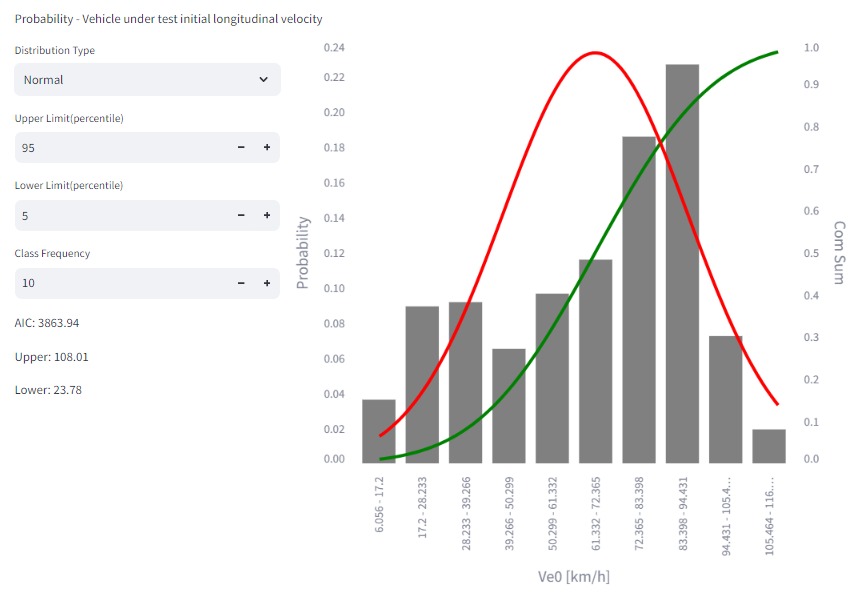
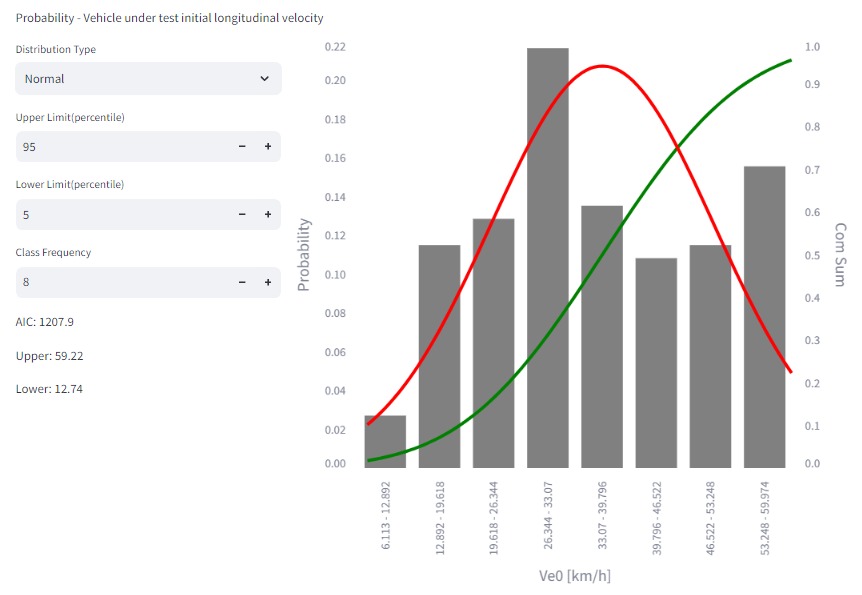
The distribution plot of each parameter for the extracted case group is displayed below the above interface. For example, the distribution of \(V_{e0}\) is shown in the bar graph below.The meanings of Distribution Type, AIC:"Akaike information criterion", and Class Frequency displayed on the screen are given in the references.
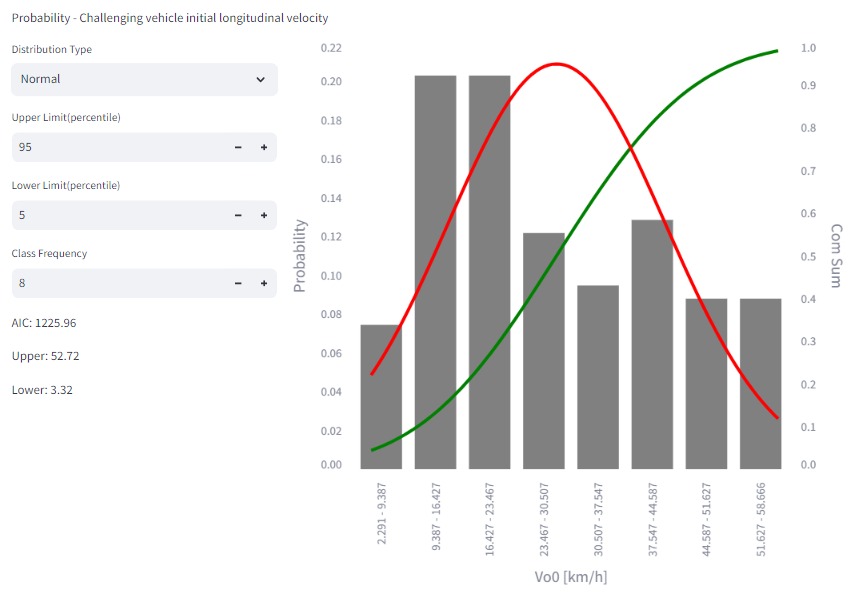
The distribution of \(V_{o0}\) is shown in the bar graph below.
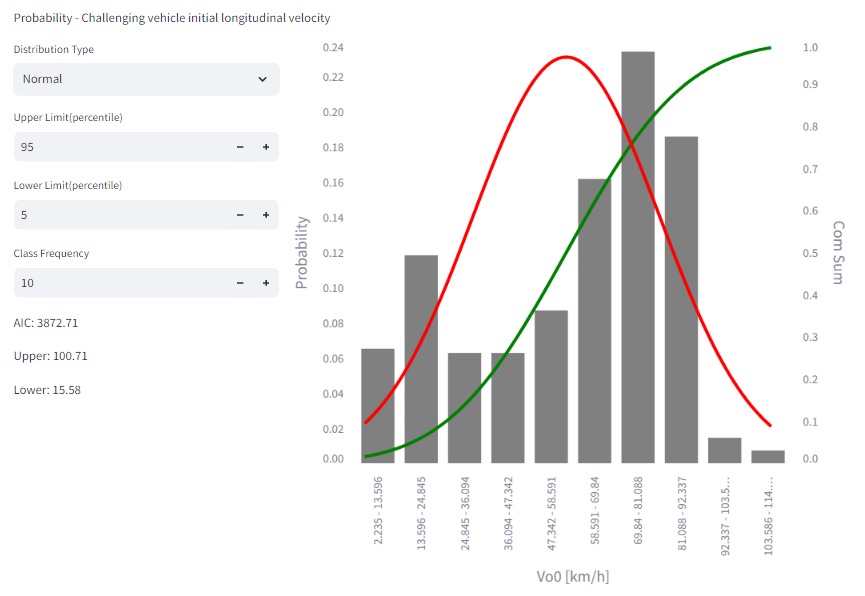
Each is shown along with its approximate probability distribution (red line) and its cumulative distribution (green line). We'll explain how to use the probability distributions later.
As a condition for ODD, let's consider "the maximum velocity of the ego vehicle (autonomous vehicle) is 60 [km/h]." In this case, it is considered that the range that is more appropriately "foreseeable" is represented by removing cases in which Vehicle under test initial longitudinal velocity \(V_{e0}\) exceeds 60 [km/h] from the group of cases extracted in scenario "No. 4."
Of the two points (red) that represent range \(V_{e0}\), slide the right-hand point as shown below. You can also use your computer's arrow keys "←" and "→" (or "↑", "↓", "<", ">") to adjust the position of the point.
Cases where scenario "No. 4" and \(V_{e0}\) are below 60 [km/h] are extracted. As a result of this extraction, the distribution of five parameters including \(V_{e0}\) and \(V_{o0}\) has been revised. The distribution of \(V_{e0}\) and \(V_{o0}\) is shown in the bar graph below.
Define the "reasonably foreseeable" range using probability distribution
It is possible to define a "reasonably foreseeable" range by the interval (= range) between the maximum and minimum values of the parameter distribution. However, there is a possibility that an outlier that should not be evaluated will be selected as the maximum or minimum value. Conversely, there is a possibility that the value that should be evaluated will not be included in the interval. To avoid this, it is possible to approximate the parameter distribution with a probability distribution such as the normal distribution, and define the range using two percentile values of that probability distribution (for example, the 5th and 95th percentile values).
In this case, we will consider approximating the distribution with a normal distribution and defining the range using the 1st and 99th percentile values ※.
※ The 3σ interval corresponds to the range between approximately the 0.27th percentile value and approximately the 99.73th percentile value.
First, check the range of \(V_{e0}\). As shown below, leave the "Distribution Type" displayed to the left of the distribution of \(V_{e0}\) as "Normal", and change the "Upper Limit (percentile)" and "Lower Limit (percentile)" to 99 and 1.
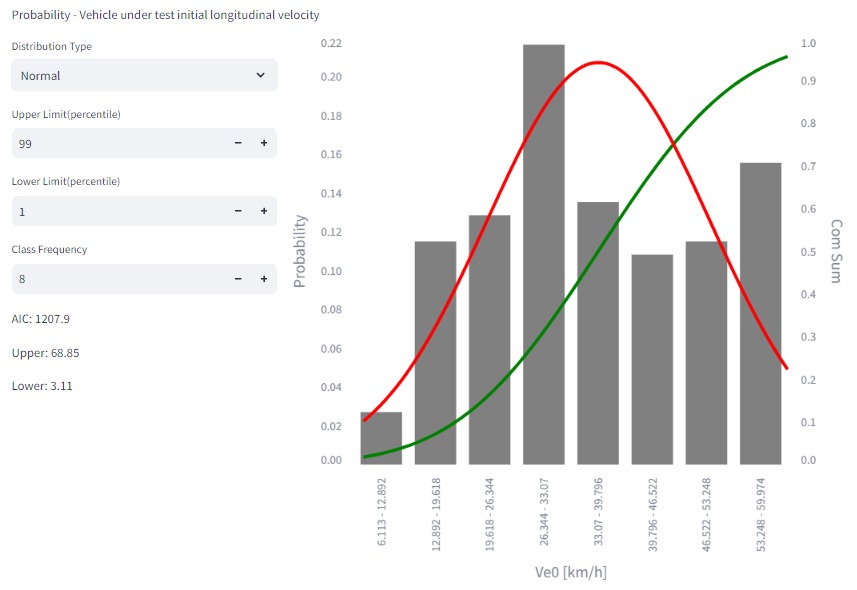
"Upper: 68.85" and "Lower: 3.11" correspond to the 99th and 1st percentile values. We can see that the range of \(V_{e0}\) is 3.11 [km/h] to 68.85 [km/h].
Similarly, set the "Distribution Type", "Upper Limit (percentile)", and "Lower Limit (percentile)" for \(V_{o0}\) and check the range of \(V_{o0}\).

"Upper: 62.96" and "Lower: -6.92" correspond to the 99th and 1st percentile values. \(V_{o0}\) is the "Initial longitudinal velocity of other vehicle that cut-in in ahead of ego vehicle" and cannot be negative, so its range is thought to be 0 [km/h] to 62.96 [km/h].
Do the same for \(V_{e0}-V_{o0}\) ,\(d_{x0}\) and \(V_{y}\).The ranges of the five parameters are as follows. These ranges will be used when Example 2:Make evaluation specifications based on the preventable range in ③ Create evaluation specifications.
Parameter |
Range |
|---|---|
\(V_{e0}\) |
3.11~68.85[km/h] |
\(V_{o0}\) |
0.00~62.96[km/h] |
\(V_{e0}-V_{o0}\) |
0.00~25.25[km/h] |
\(d_{x0}\) |
0.00~46.66[m] |
\(V_{y}\) |
0.28~1.53[m/s] |
Reference: Distribution of case groups
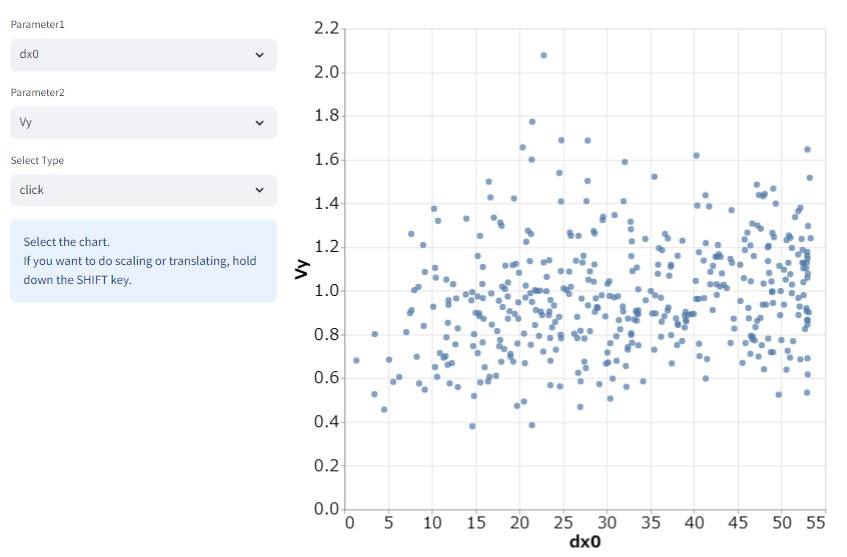
The distribution of the cases used to calculate the "reasonably foreseeable" range can be viewed on a two-dimensional plane of parameters. Scroll to the bottom of the screen and select \(d_{x0}\) for the horizontal axis (Parameter 1) of the chart, and \(V_{y}\) for the vertical axis (Parameter 2).
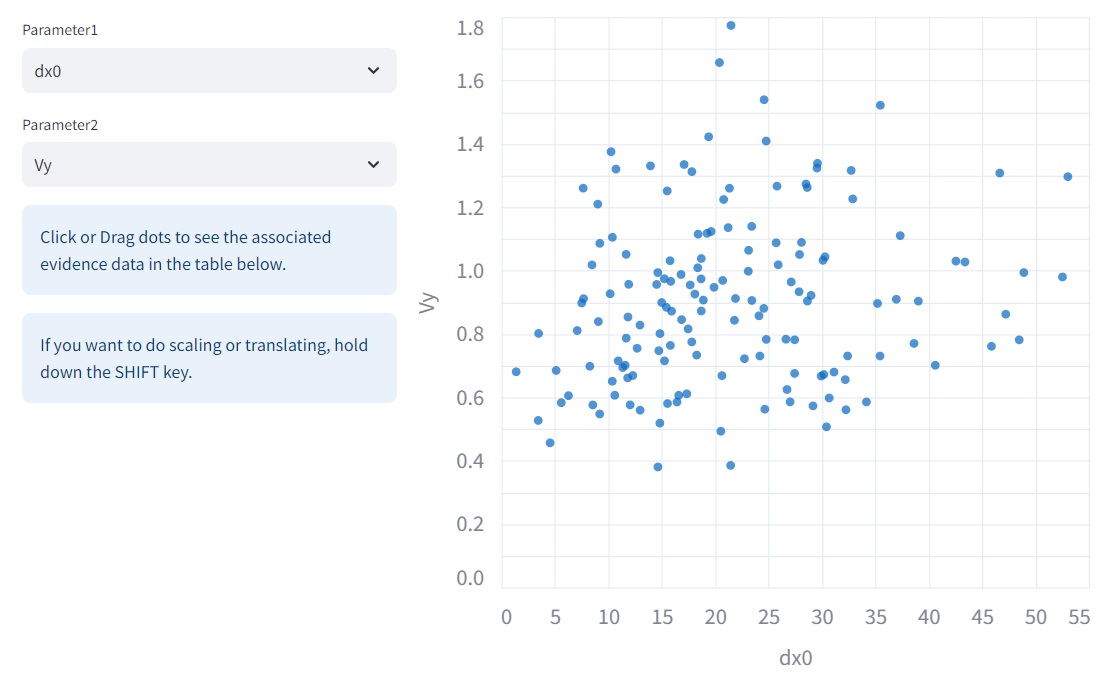
This distribution may vary depending on the values of \(V_{e0}\) and \(V_{e0}-V_{o0}\). Please limit the ranges of \(V_{e0}\) and \(V_{e0}-V_{o0}\) as follows:
The distribution of cases with \(d_{x0}\) on the horizontal axis (Parameter 1) and \(V_{y}\) on the vertical axis (Parameter 2) is as follows.
Although the number of examples in this distribution is small, it is believed to represent the local distribution. The results obtained by narrowing down the parameters (the 1st percentile value and the 99th percentile value when approximated by a probability distribution) are shown below.
Parameter |
Range |
|---|---|
\(V_{e0}\) |
35.25~64.76[km/h] |
\(V_{o0}\) |
16.31~52.50[km/h] |
\(V_{e0}-V_{o0}\) |
5.47~25.73[km/h] |
\(d_{x0}\) |
9.52~60.14[m] |
\(V_{y}\) |
0.28~ 1.71[m/s] |
Reference: Search conditions
As a condition for ODD, we have considered "the maximum velocity of ego vehicle (autonomous vehicle) is 60 km/h".In addition to conditions using parameter ranges like these, other possible conditions include Case type (type of road measured, such as highway or general road), Data Set (type of measurement method, such as measurement vehicle or fixed point observation), and Weather. The latter conditions are simply called "search conditions" here, and are available to the right of the parameter range setting, as shown below.
Notation |
Contents |
|---|---|
Case Type |
Measurement target |
Data Set |
Data Set |
Weather |
Weather |
Average of Road Curvature |
Road curvature average value |
Minimum of Time To Collision |
TTC(minimum value) |
Type of Highway |
Type of Highway |
In this public version, the data preparation required to realize the "search conditions" function has not been completed. In this tutorial, we will continue the explanation without setting "search conditions".
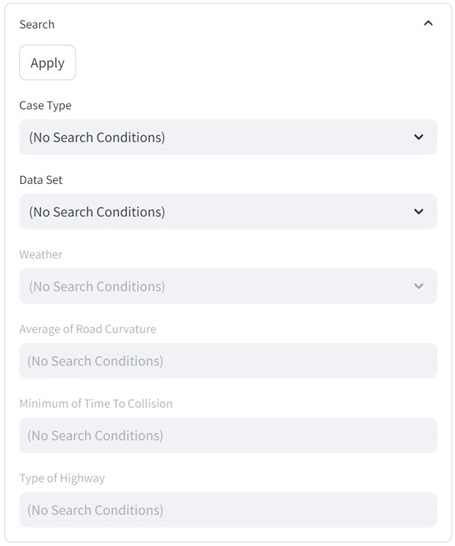
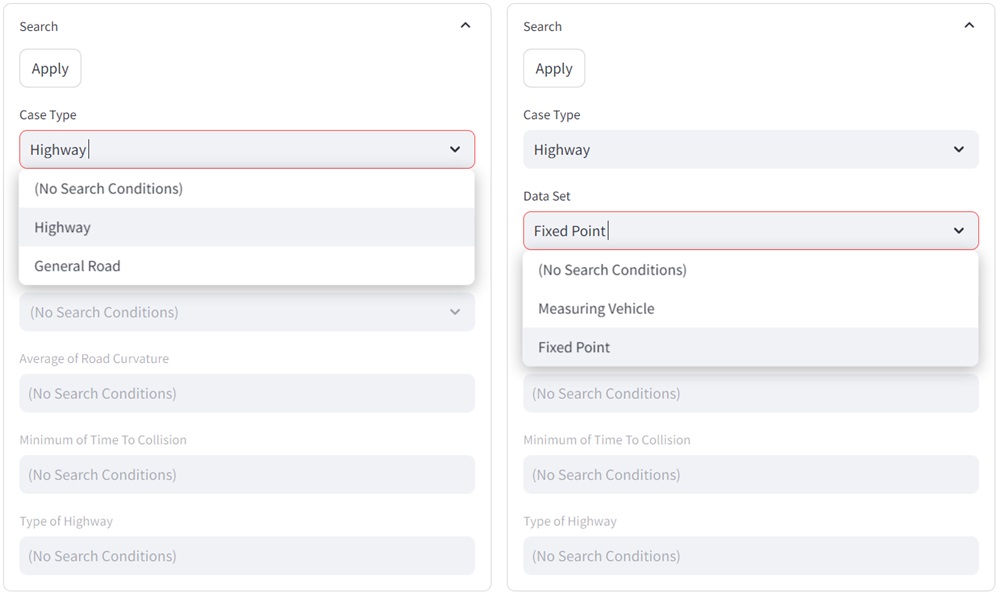
Reference We will explain how to set Case Type, Data Set, etc. in the "Search Conditions" for your reference. For example, Case Type has three options: ((No Search Conditions), Highway, General Road), and you must select one of them. Below is a sample where Highway is selected as the Case Type and Fixed Point is selected as the Data Set.
Note: If you set the "Search Conditions" and left-click the "Apply" button, you will not be able to follow the contents of the tutorial that follows. If you accidentally left-clicked the Apply button, left-click the x mark on the "Surrounding Traffic Database" tab to close the "Surrounding Traffic Database" tab. Then, start over with "Define Reasonably Foreseeable Range".
Confirmation of derivation basis
The "reasonably foreseeable" range was defined based on the distribution of cases that met the conditions of the evaluation scenario, and various information (traceability data) that identifies each case can be confirmed, such as the observation date and time, observation location, road shape, observation method, and data processing management number.
Below, we will use scenario "No.4" as an example to explain the procedure for checking the "observation date and time" and "road shape".
Earlier, we limited the ranges of \(V_{e0}\) and \(V_{e0}-V_{o0}\) as follows.
For the sake of explanation, please change the ranges of \(V_{e0}\) and \(V_{e0}-V_{o0}\) as follows ※1:
※1 We are preparing to provide detailed information on all cases, but this is not yet complete. We have prepared several cases for each of the 58 scenarios, so we will relax the extraction conditions and explain the procedure for confirming the derivation basis. This time, we will extract all cases of scenario “No.4” without applying any parameter conditions.
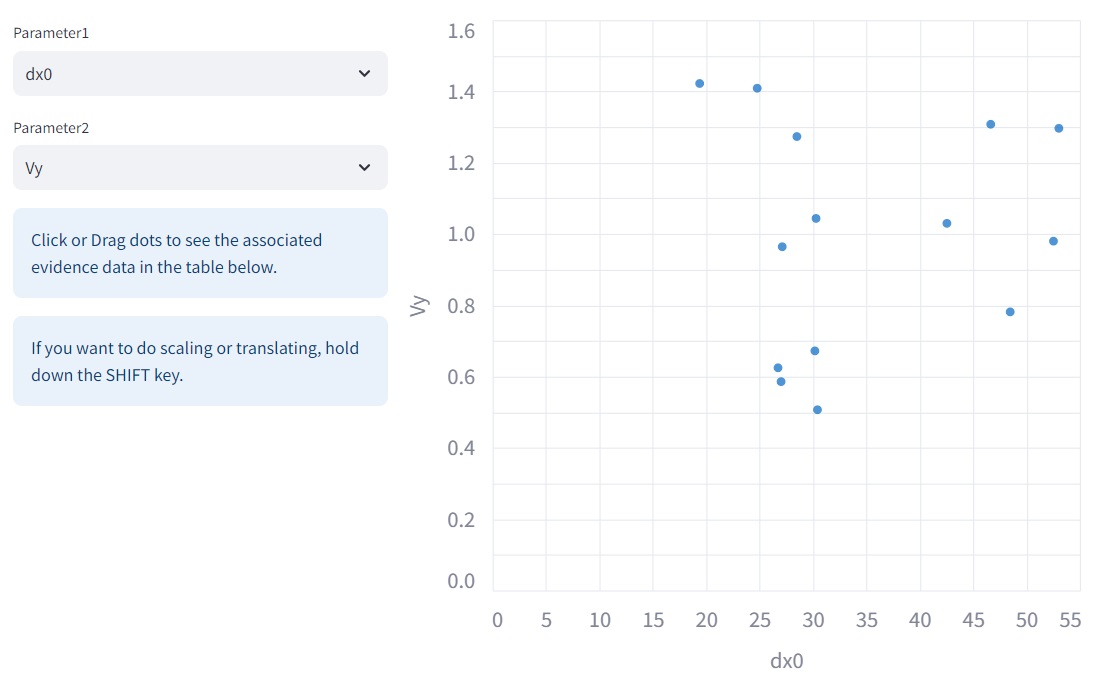
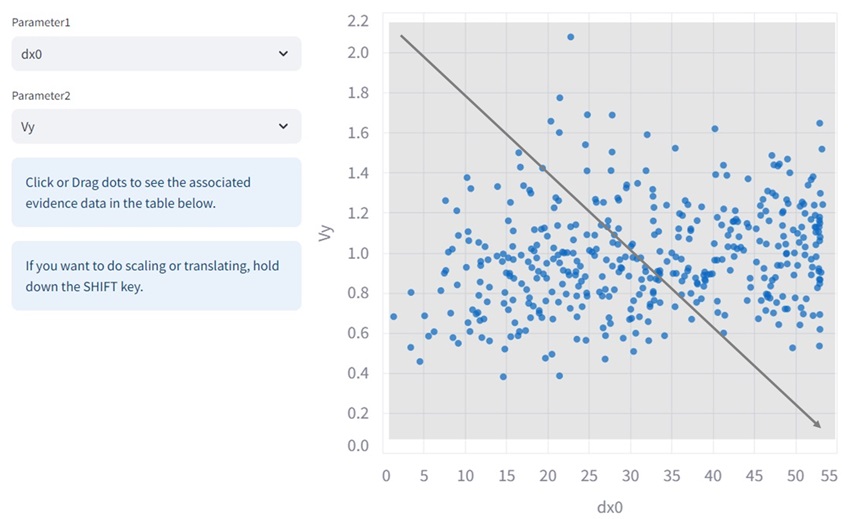
The following screen will be displayed. All cases { \(d_{x0}\) ,\(V_{y}\) }of scenario "No.4" are displayed.
Next, left-click and hold a corner ※2 of the range so that it covers the entire screen, then move the mouse and release the hold when you reach the opposite corner ※3, All cases will now be selected, as shown in the screen below.
※2 It can be the top left, top right, bottom left, or bottom right corner.
※3 For example, the opposite of upper left is lower right, and the opposite of upper right is lower left.
As a result of this operation, the following information will be displayed at the bottom of the screen:
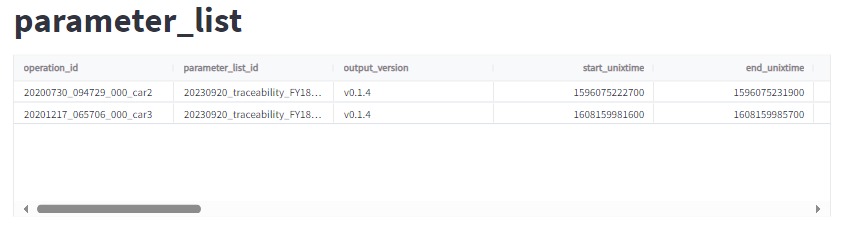
Two lines of information are displayed in the "Parameter_list" display. Normally, information for all the cases selected earlier would be displayed, but the F24 public version was not ready in time, so only two cases are displayed.
Explain "Parameter_list". First, left-click on “Link to ER Diagram of Evidence Data” displayed below the distribution diagram of { \(d_{x0}\) ,\(V_{y}\) }. A PDF file containing the following ER diagram ※4 will be downloaded. "Parameter_list" is written as "Parameter List" in ER Diagram.
※4 ER Diagram (Entity Relationship Diagram) is a typical design diagram used in database design.
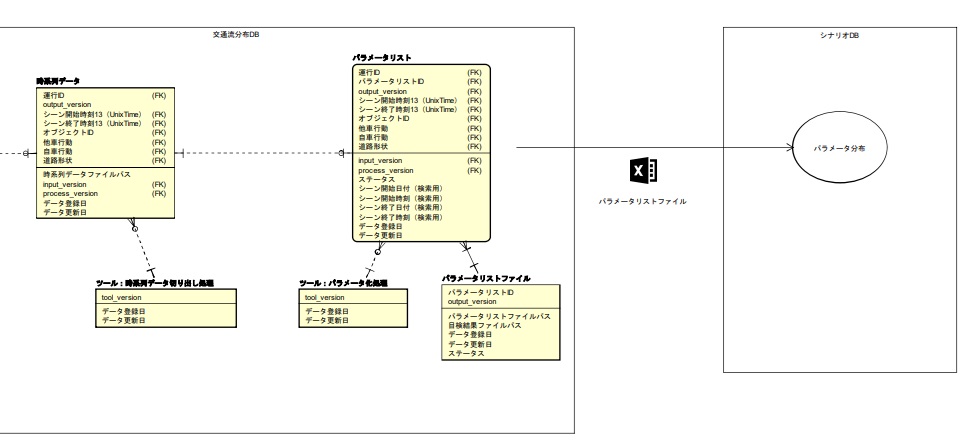
The "parameter list" is a list consisting of "operation ID", "parameter list ID", "output_version", etc., and it can be seen that it is linked to the "parameter list file", "tool: parameterization processing" and "time series data". It can also be seen that the "time series data" is linked to the "scene extraction results" and "tool: time series data cut-out processing". In this way, links are established between the data, and you can follow the links to find the data you need.
Look at "Scene start date (for search)" and "Scene start time (for search)" included in the "Parameter list".
Adjust the slider under "Parameter_list" until the following screen appears.
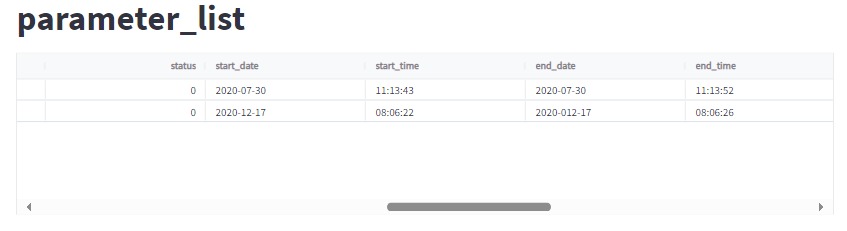
In the example on the first line, we can see that the "Scene start date (for search)" (start_date) is July 30, 2020, and the "Scene start time (for search)" (start_time) is 11:13:43.
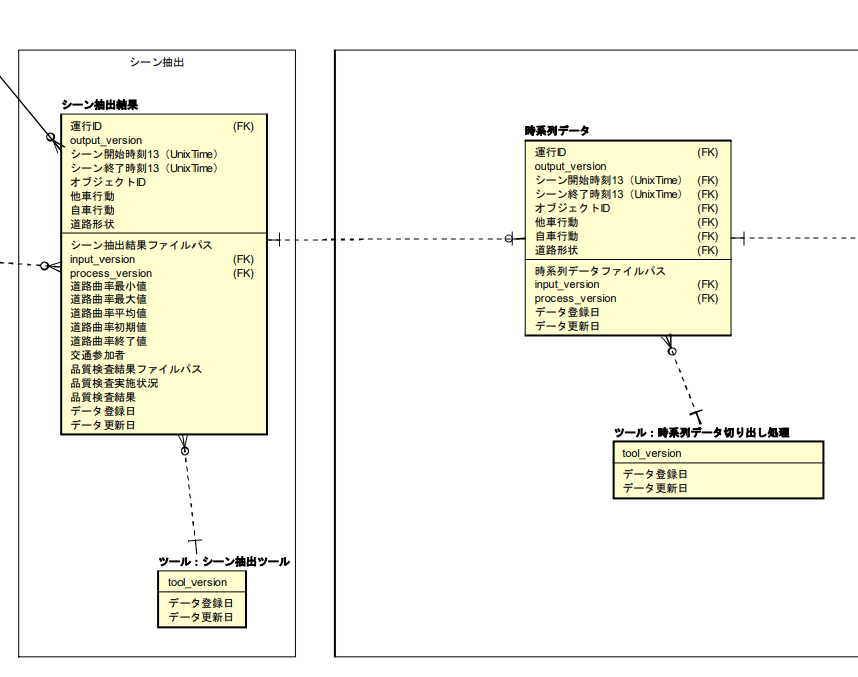
Next, we will explain the procedure for finding the "minimum road pseudo curvature" and "maximum road pseudo curvature". They are included in the "scene extraction results".
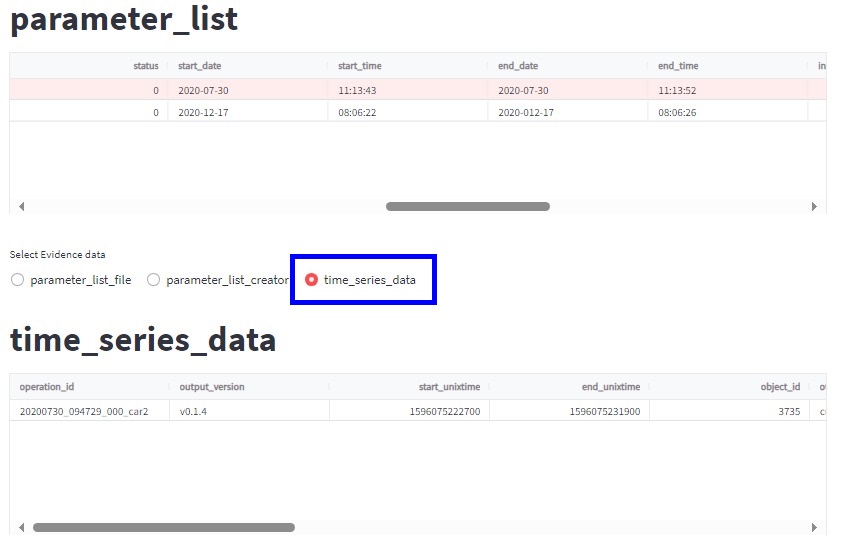
Left-click on the example registered in the first line of "Parameter_list". The following screen will be displayed※5.
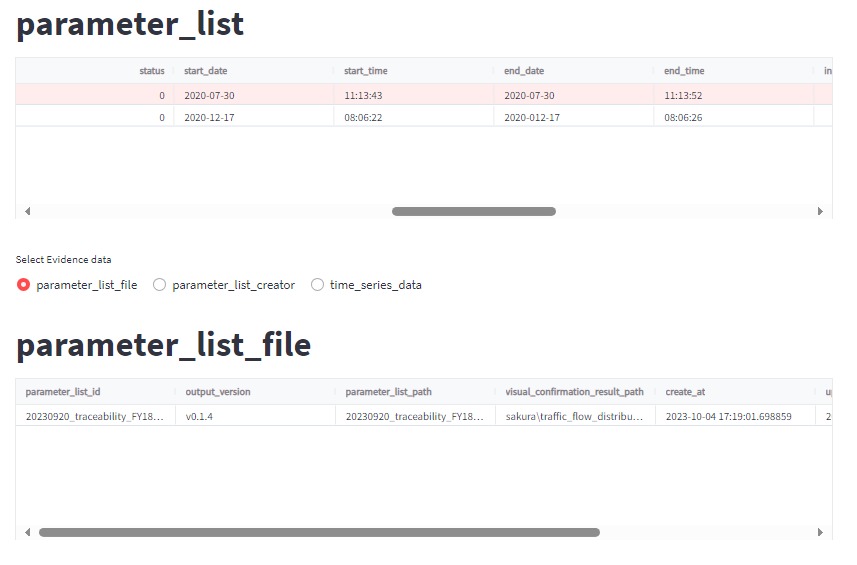
※5 "parameter_list_file", "parameter_list_creator", and "time_series_data" correspond to "Parameter List File", "Tool: Parameterization Processing", and "Time series data" in the ER Diagram.
Left-click on the circle displayed to the left of "time_series_data" on the screen (inside the blue frame). It will turn red as shown below.
When you left-click on a case shown in "time_series_data", the following screen will be displayed ※6.
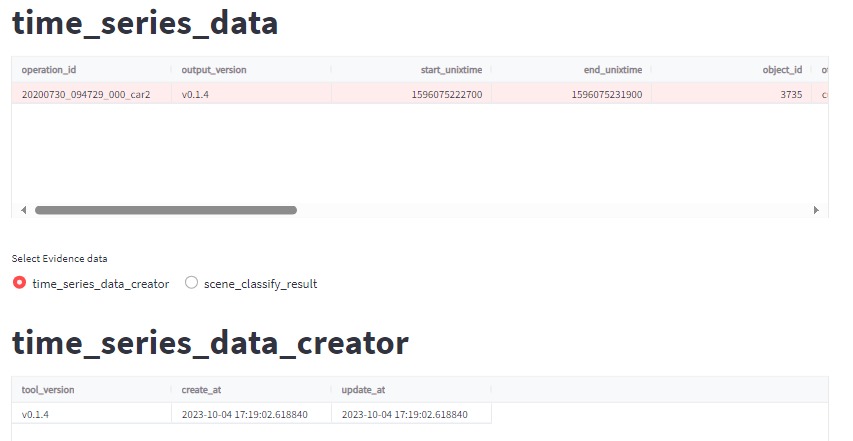
※6 "time_series_data_creator" and "scene_classify_result" correspond to "Tool: Time series data extraction processing" and "Scene extraction result" in the ER Diagram.
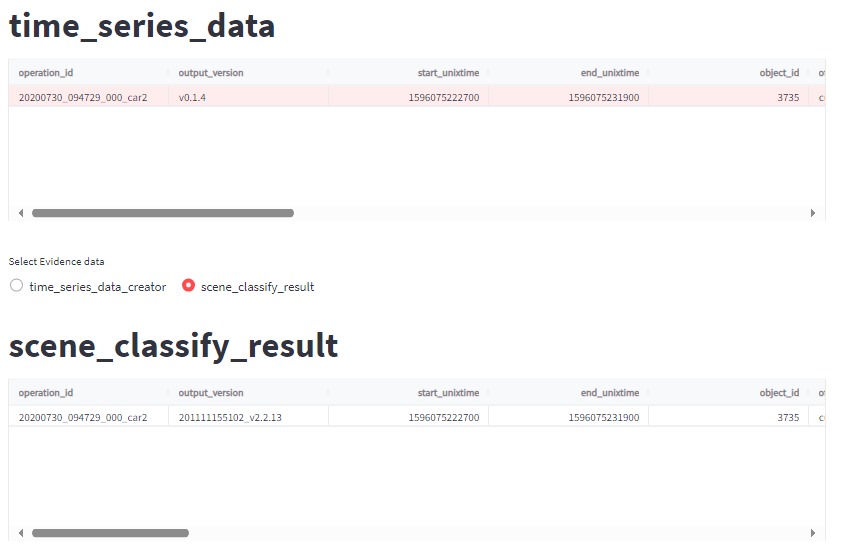
Left-click on the circle displayed to the left of "scene_classify_result" on the screen. It will turn red as shown below.
Adjust the slider under "scene_classify_result" so that the following screen appears.
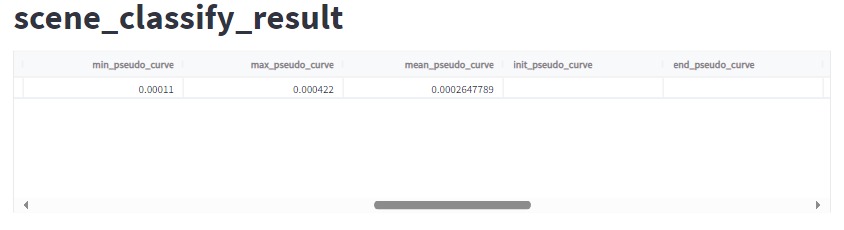
In the example, it can be seen that the "minimum road pseudo curvature value" is 0.00011[1/m] and the "maximum road pseudo curvature value" is 0.000422[1/m].
In this way, you can use the ER Diagram to check the links between data and examine the information at the linked destination. This concludes the explanation of "Confirmation of derivation basis".