Scenario Analysis
Analyze the parameters and distribution of each scenario scene from the trajectory data. (Explain the cut-in scenario as an example).
Extraction of Targeted Scenario Scene
The extracted trajectory data includes the corresponding scene in the referenced scenarios [JAMA AD Framework]. Therefore, it was necessary to extract scenes corresponding to the scenario.
In this project, we have established method for extracting scenarios from trajectory data using rule-based algorithm.
The cut-in scenario will be used as an example to explain scenario scene extraction.
The figure shows the parameter definition of the cut-in scenario scene.
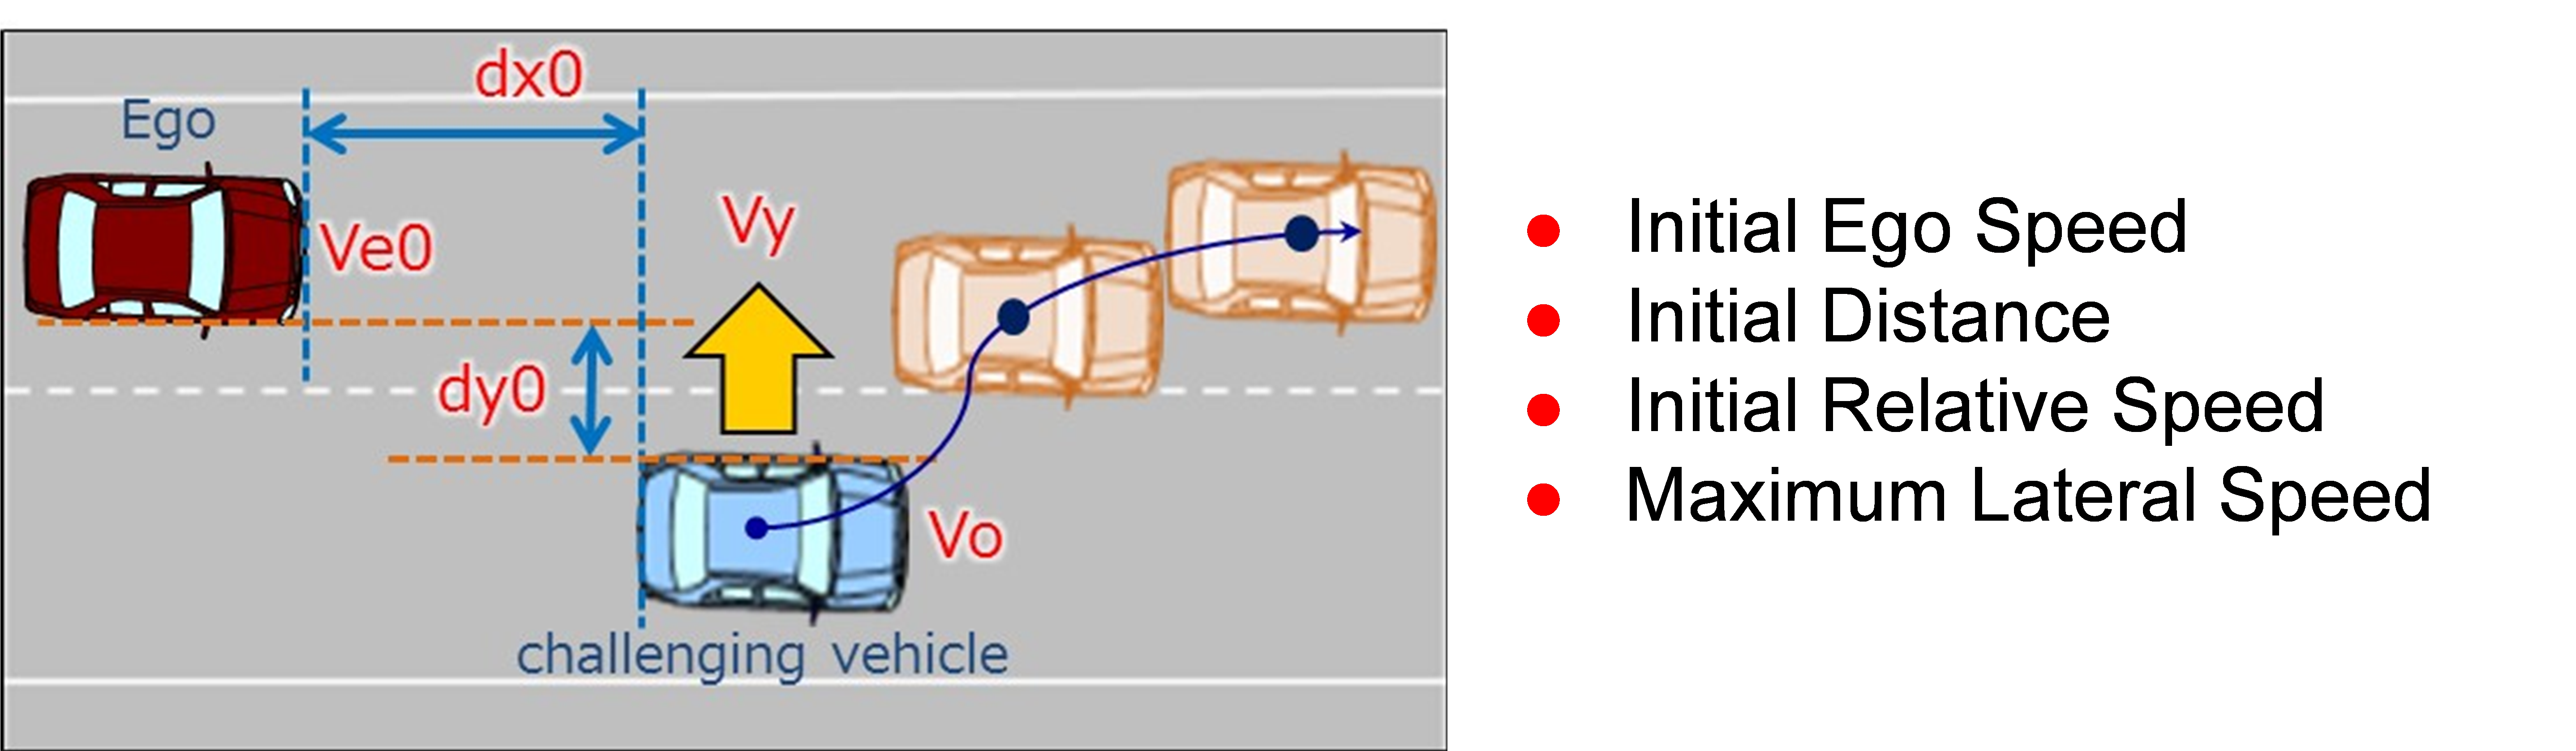
Figure. Definition of required parameters (Cut-in Scenario)
Using the cut-in parameter definition and the following rules, we created an algorithm to extract the cut-in scenario scene.
- The cut-in vehicle’s lateral velocity remains constant in the same direction
- The other-vehicle enters the ego-vehicle’s lane from a contiguous lane
- Absence of vehicles between the other-vehicle and the ego-vehicle
- Start: The other-vehicle’s lateral velocity value increases from 0
(Positive value to the right of the vehicle)
- End: Lateral velocity returns to 0
The scenario is analyzed using the scenario extracted from the real traffic (trajectory) data from this algorithm.
Extraction of Parameter Values
The parameters of the cut-in scenario extracted from the real traffic (trajectory) data are organized. [Nakamura et al. 2021]
The figure shows the parameter distribution of cut-in scenario acquired between 2018 and 2020.
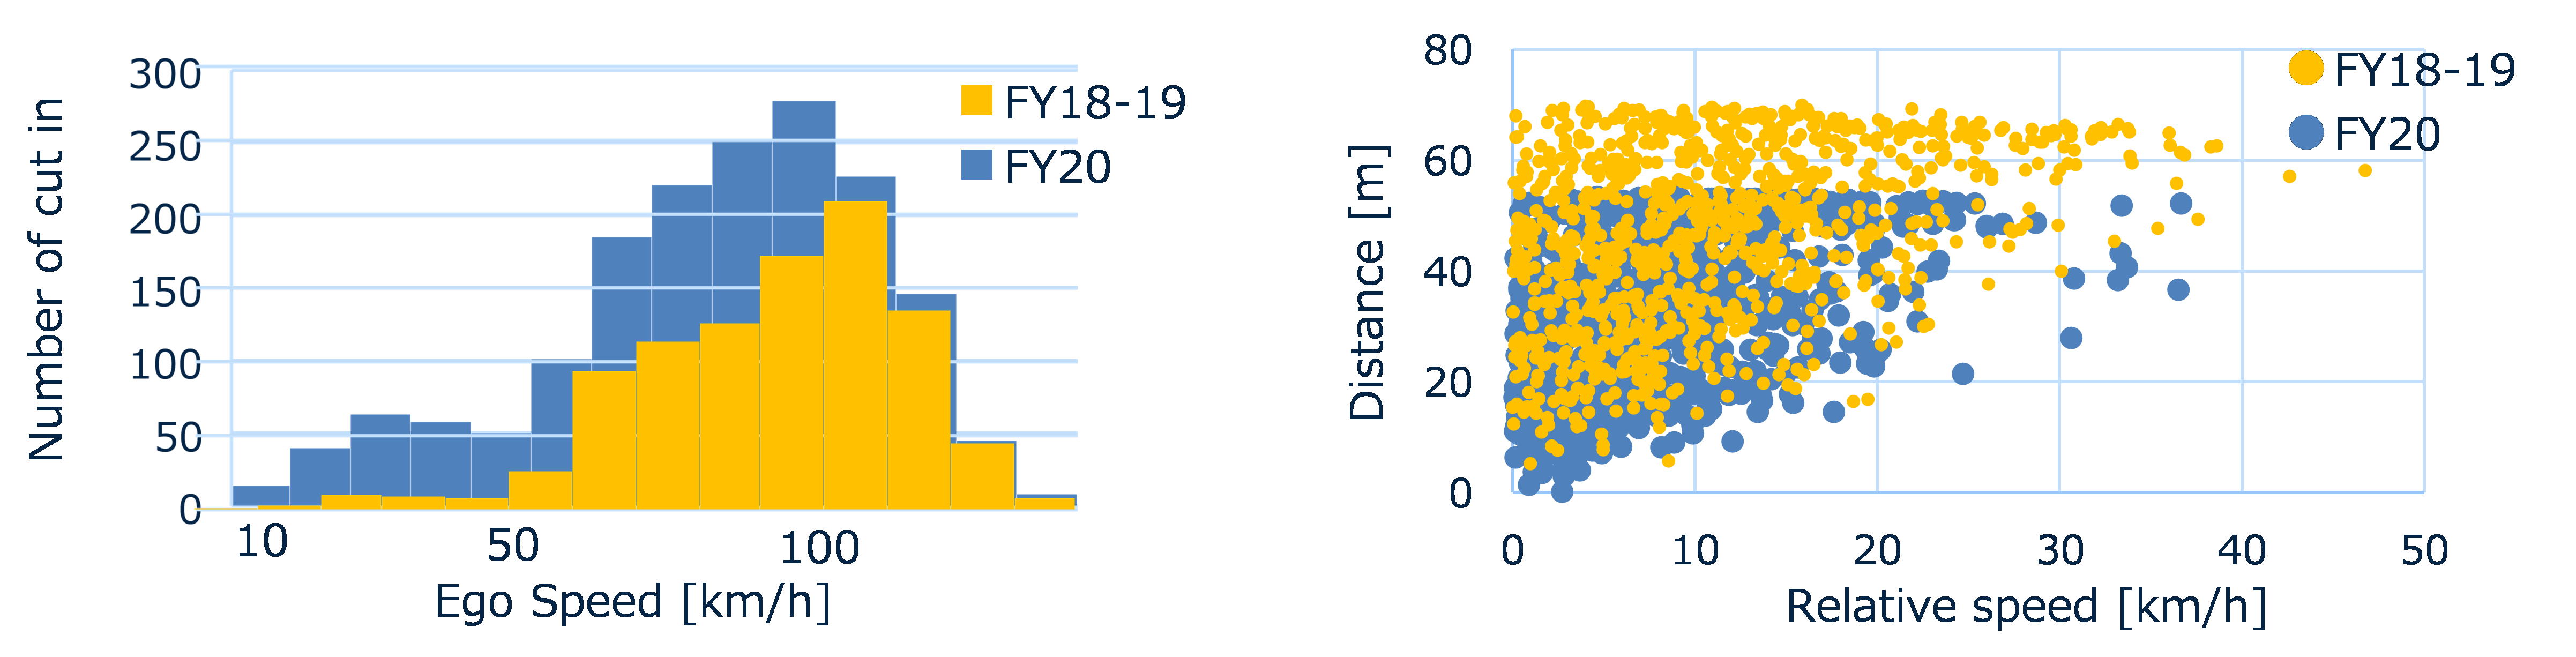
Fig. Distribution of cut-in scenario parameter
Estimation of parameter distribution
The acquired real traffic data cannot drive comprehensively in Japan. Therefore, the distribution may be biased. [Nakamura et al. 2021]
Additional analysis was performed on the parameter distribution of the cut-in in real traffic, and the parameter distribution was estimated. [Nakamura et al. 2021]- Estimating parameter distribution with β distribution (finite and continuous)
- Considering correlation between parameters
- Extrapolation for sensor range limitation and rare cases
- Estimation of multi-dimensional parameter distribution
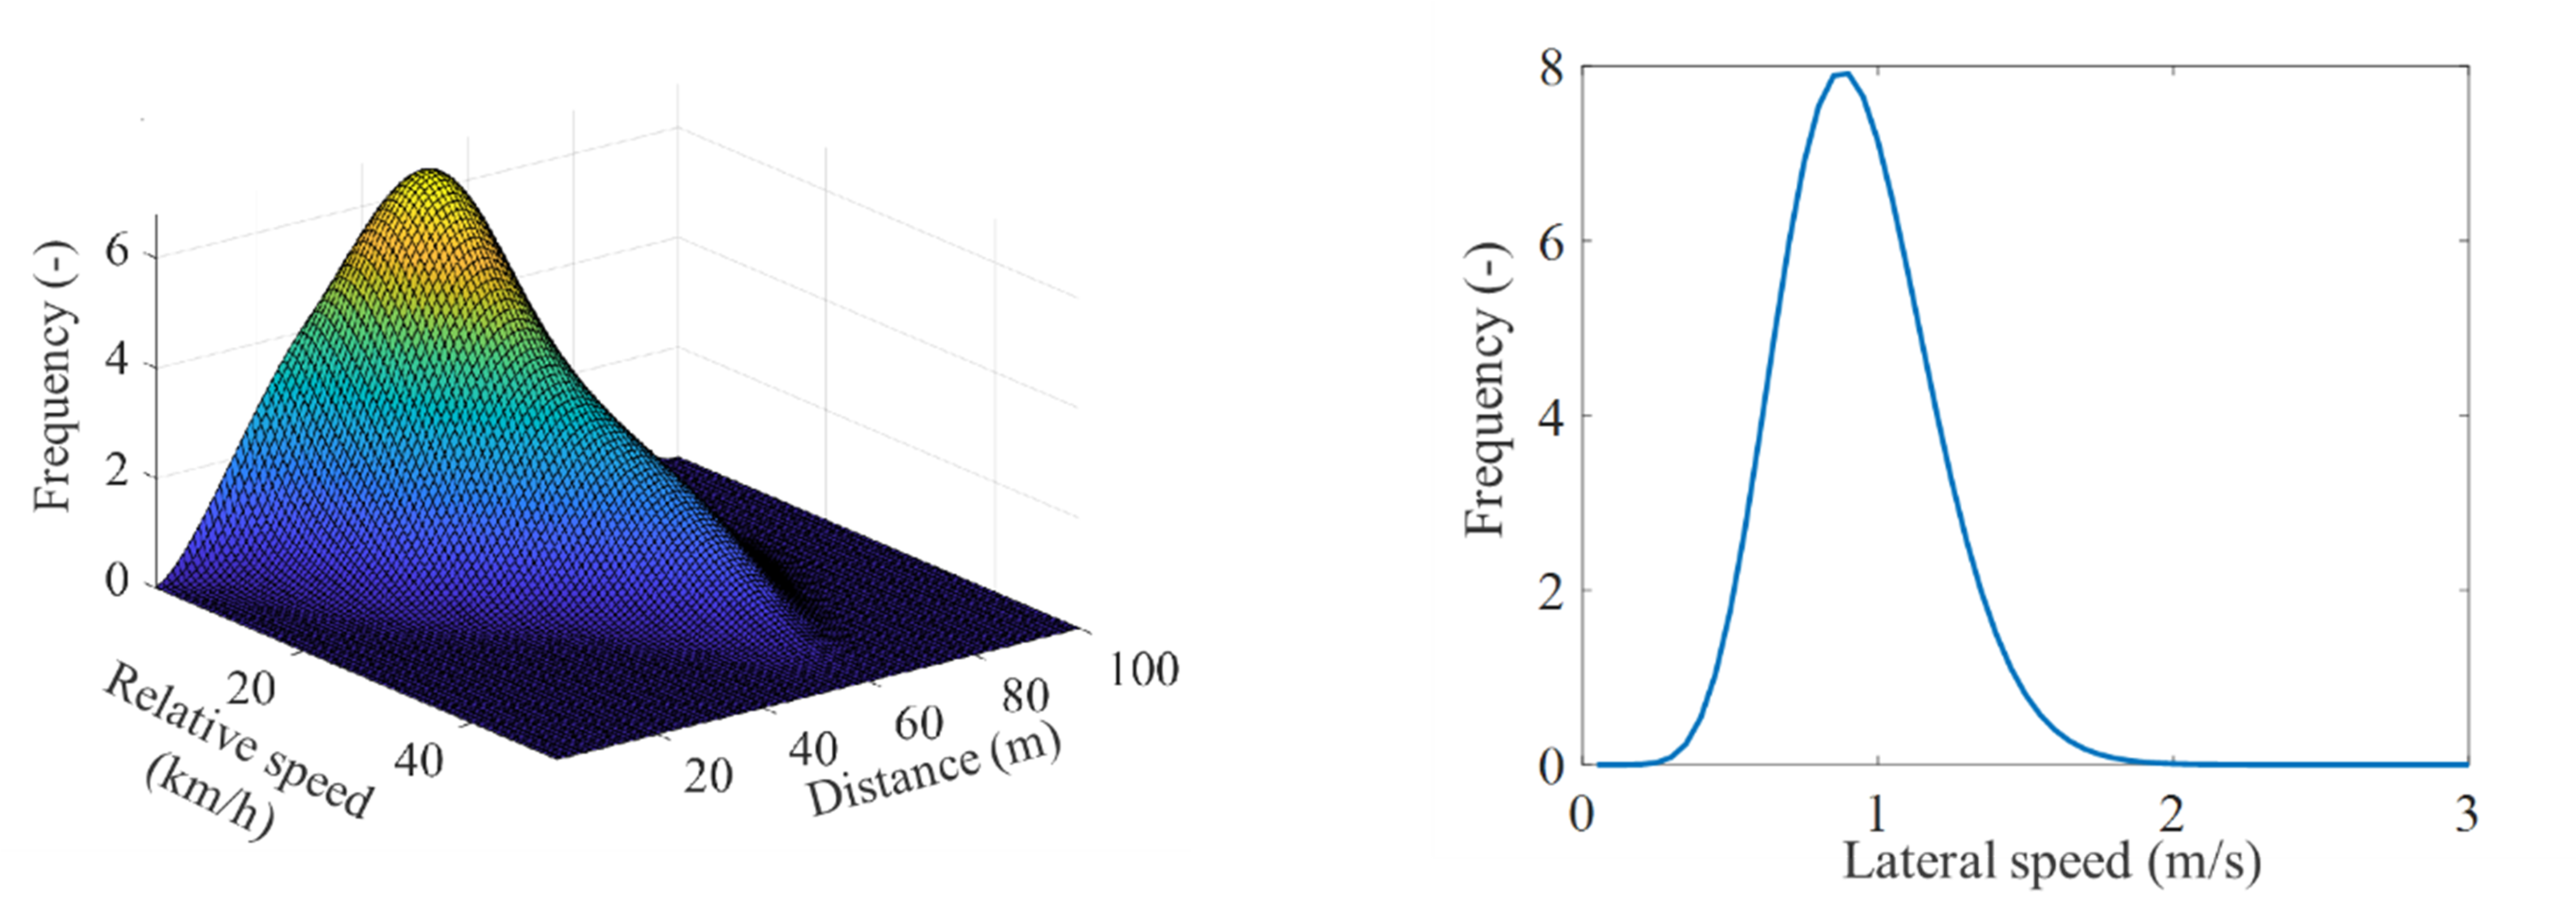
Fig. Estimation of parameter distribution (cut-in scenario)
In the SAKURA research project, these analysis results are continuously accumulated as evidence.